7 Best Food and Beverage Cost Calculation Tips
What is a Cost of Sales Percentage and how do you calculate Food and Beverage Costs?
Cost of Sales is also called Cost Of Goods Sold in some establishments and helps one understand what it actually represents. Whatever you call it, as it pertains to a restaurant it is defined simply as the percentage of total revenue, or sales, that was spent on raw product or goods to be sold in a given area.
What those numbers or percentages should be will vary slightly from restaurant to restaurant. While the calculation is the same throughout, each establishment may differ in what they categorize as food cost or beverage cost. We’ll start by explaining food cost and discuss beverage cost as we move on. First we need to understand how our Food Cost is calculated.
1.The Food Cost Calculation Explained
When discussing Food Cost most people are referring to the percentage part of the equation. It’s imperative to start with precise numbers to get a precise outcome. An outcome which can be not only predictable, but consistent and manageable over the long term.
- Calculating the dollars and cents.
The formula is simple:
Beginning Inventory + Purchases – Ending Inventory = Cost of Goods.
- Beginning Inventory – A Beginning count of inventory stock
- Purchases – The amount you purchased based on invoices
- Ending Inventory – The new amount of inventory after count
- Cost of Goods – The value of that product at the end of the equation
For Example:

This is your Cost of Goods dollar amount. This is the tangible dollars that it costs to make your sales revenue.
If you have not done a beginning inventory or don’t know where to start, I discuss some inventory basics and strategies here.
- Calculating the percentage
Now take that amount and divide it by sales:
For this example our Sales Amount = $17,500
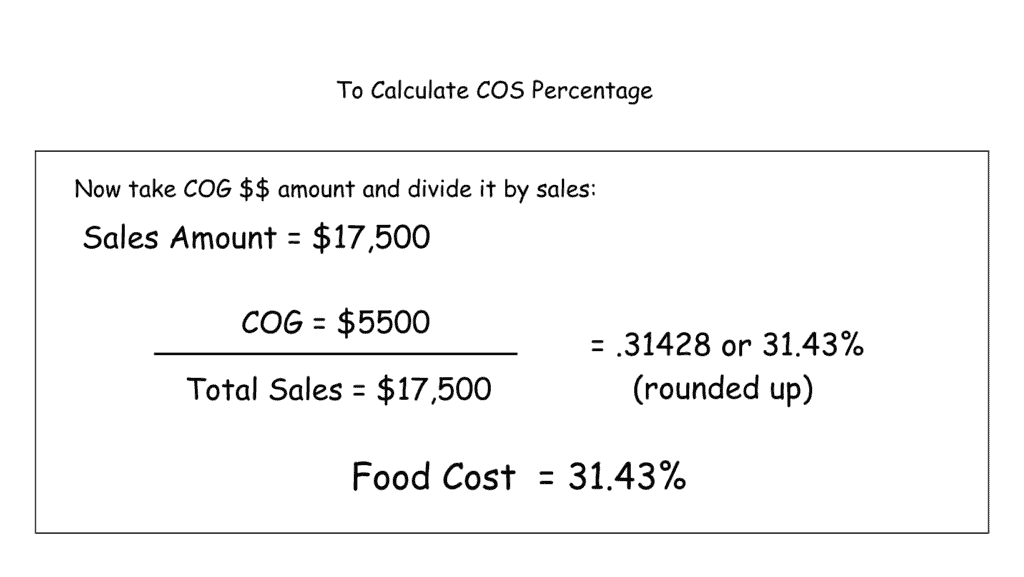
Use this same formula for all of your Cost of Goods calculations. However when it comes to Food Cost, you only want to use food products and food sales. It should always be measured as its own category.
For Instance, using the above numbers and adding in Beverage Mix:
Total Restaurant Sales = $21,500
- Food Sales = $17,500
- Beverage Sales = $4000
Cost Of Goods
- Food = $5500
- Beverage =$850
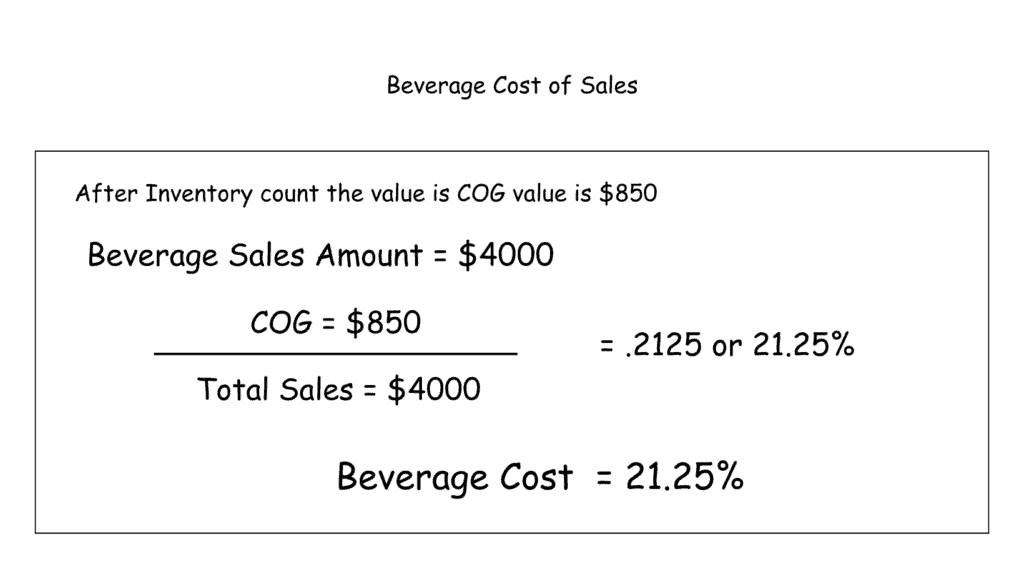

Using those same numbers, you can do the math and see that we get a blended, or Total COG of $6350 for 29.53%.
It’s important to note that some restaurants, especially smaller ones may use a blended or total COG system. However as you grow cost management becomes easier with separate inventory systems in place and may even help facilitate said growth.
2. Identify the Main Categories
Two main Cost of Sales categories:
- Food Costs
- Beverage Costs
Many operators, even some larger ones include beverage cost in their analysis when referring to Food Cost. I advise against this if possible. While there may be some who disagree, my arguments for this are simple.
- You Serve Alcohol
If you’re serving alcohol or have a bar then:
- Separate control measures are needed
- Commodity Brokerage
- Some states may have different pricing structures on liquor or wine that vary from month to month due to the way that the commodity is brokered.
- Price Fluctuation
- Those fluctuations in price can dramatically change the metrics on your actual food cost when you’re trying to maintain consistency from a control standpoint.
- Not having to chase fluctuations is just easier to manage
- Those variable costs may actually mask a problem area where food is concerned.
- You Don’t Serve Alcohol
If you don’t have a bar and don’t sell any alcoholic beverages, then it is possible to include the beverage aspect into your food cost. However I suggest separating Beverage or Non-Alcoholic into at least its own category and managing it as its own Cost Area. I’ll explain more about this when we talk about Category Isolation in the next section.
The reasoning behind this lies in the fact that:
- Different people are in direct contact with each area.
- Food Cost is related to the behaviors and habits of your BOH or kitchen staff.
- Beverage Cost is just about completely impacted by the FOH or service staff.
- While the expectations may be the same as it pertains to cost control, the training or specialization for each area of responsibility are different.
Whether food or beverage, the Cost of Sales Formula remains the same for each category.
3. Food Cost Main Categories
Now that we’ve segregated Food Cost into its own category, we need to isolate categories down even further to be as efficient as possible when managing these numbers. You should have at least 4 basic categories.
I suggest breaking it down like this:
- Meat / Protein
- Dairy
- Produce
- Dry Goods
Isolating these areas will give you consistent results over time. While produce costs fluctuate throughout the year, so do beef, seafood and other proteins, it will still give you a baseline for each category to find discrepancies. If you use or sell a substantial amount of seafood, you could add a separate category for that specific protein.
If you use wine or liquor in the kitchen, then by all means add a category for that. You can easily cost out what you use specifically to Food Cost when accounting for purchases or doing inventory. If you consistently use the same product at quantity, then check with your supplier to see if they will invoice that product separately when placing your order. I’ve done this in the past and have always been accommodated.
4. Beverage Cost Main Categories
If you have a full bar, then your categories should be:
- Beer
- Wine
- Liquor
- Non-Alcoholic
Depending on your concept or type of food you serve, the sales amount for each category can differ quite substantially.
- Mexican Restaurant – Heavy Liquor, Margarita sales, Beer
- Rustic/Classic Steakhouse – Heavy Beer, Balanced Liquor, Wine
- Upscale, Fine Dining – Heavy WIne Mix, Balanced Liquor, Beer
- Barbecue – Probably All Beer
- Etc.
Having separate categories here is all about having control numbers. Your cost percentage of each category will vary based on your pricing structure, concept, and amount of each category’s product mix percentage to the whole sum of bar or beverage sales.
Having a full service bar can be quite lucrative financially, however presents a completely different set of challenges from a management perspective. If not properly managed, costs can spiral out of control quickly.
5. Non-Alcoholic Beverage Category
In smaller restaurants or those that don’t serve alcohol it is feasible and even commonplace to merge beverage cost with food cost. However the category cost still requires vigilant management however you undertake the task.
You must be aware of all of the possibilities for these costs to become menacing.
Things like:
- Soda scams
- Servers not charging for drinks, or charging incorrectly.
- Employees taking home large To Go drinks.
- Prep waste when it comes to fruit and garnish.
As we all know beverage mixes and bag in box costs continue to rise. Which is why even if you only sell nonalcoholic beverages, I strongly suggest classifying this area separately and managing it accordingly.
Lack of attention in this area can leave you scratching your head at the end of the month, wondering how this number got out of control so quickly.
6. Food Cost Expectations
Knowing what your food costs should be is referred to as Theoretical Food Cost. This is the percentage that number should be given a perfect scenario.
This number is derived by a number of factors:
- Menu Costing & Pricing Structure
- Product Sales Mix Percentage
- Market or Invoice Pricing Changes
- Individual Buying Strategy
- Supply Chain & Product Availability
Across the industry, most restaurants average in a range of 30-35% for actual Food Cost numbers. When costing out a menu though, we can’t just go with a 30% number across the board and hope for the best. That strategy doesn’t work.
The different costs of items and what a restaurant can charge and still be competitive, will ultimately determine the theoretical vs actual numbers. You may have a popular appetizer whose theoretical cost is 29%, and an entree that is 33 or 34%.
Both items sell and are profitable but having different costs and the amount you sell of each item, or product mix, will change the overall Food Cost expectation.
7. Beverage Cost Expectations
When it comes to theoretical beverage cost, it gets a little more complicated. Product sales mix percentage has everything to do with this number if you’re selling alcohol.
- Heavy Liquor mix – percentage will be lower
- Heavy Wine mix – percentage will be higher
Overall this number can vary based on your region, and your buying strategy if you’re in a market where commodity prices change monthly.
However, a typical baseline for each individual category might look something like this:
- Liquor – 17-21%
- Wine – 34-39% (Even higher in some markets)
- Beer – 23-28%
- Non-Alcoholic – 28-32%
While it may look like a large range in those figures, what your market will bear in competitive pricing has a dramatic impact on the actual number.
Tracking historical sales data over time will give you a better understanding of your theoretical costs, and how even that number can change based on seasonality.
Closing The Tab
Whatever way you decide to manage your food and beverage cost, the key is to be consistent in your approach. Having accurate inventory counts, historical sales data and the proper pricing structure for your market in both categories will help you determine what your costs should be and how to manage those areas for the greatest impact to your profitability.
Knowing how to arrive at a theoretical number allows you to communicate the expectations to your staff and train them on proper handling methods, sales goals and cost awareness to achieve success in this high impact area. So let’s do something today that makes your next shift, your best shift!

